 8b1d51ab3c
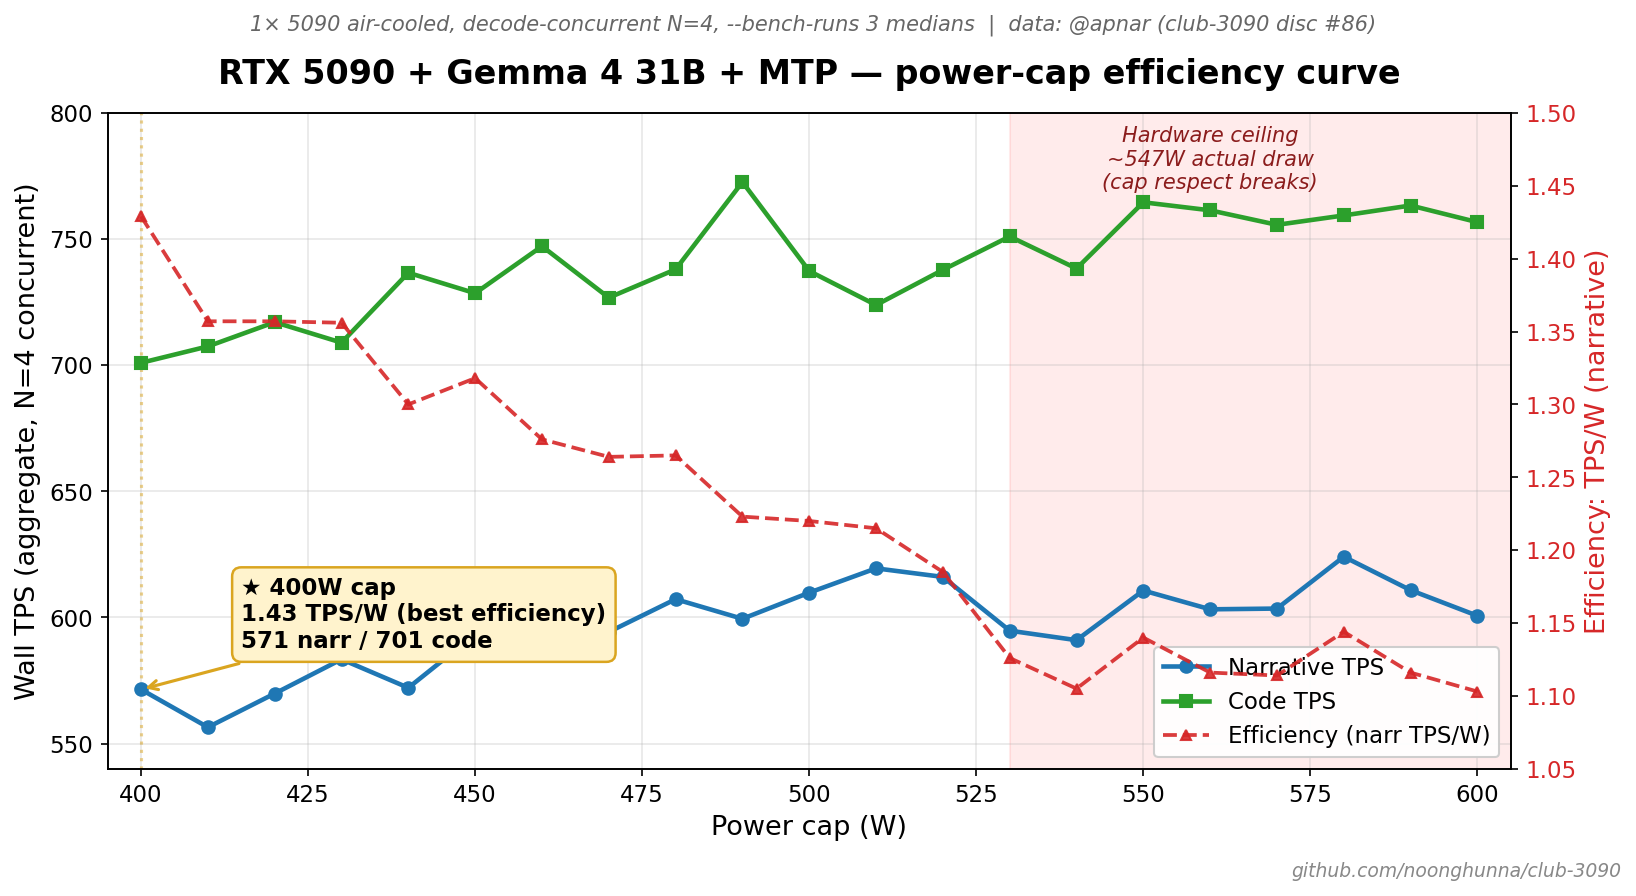
Visualizes @apnar's 21-cap 10W-resolution sweep from disc #86 with
three signals on one chart:
- Narrative TPS (peaks 619 at 510W cap)
- Code TPS (peaks 773 at 490W cap)
- Efficiency TPS/W (monotonic 1.43 → 1.10 from 400W → 600W)

Sweet-spot annotation at 400W (1.43 TPS/W). Red-shaded zone 530-600W
shows workload-saturation (~547W max actual draw regardless of cap,
not thermal throttle — GPU temp peaked 66°C).

Includes the source script (docs/img/power-cap-5090-gemma4.py) so
future contributors can regenerate or adapt the chart for other rigs.
Generated via uvx --from matplotlib --with numpy.

Embedded in HARDWARE.md right after the cross-rig power-cap data table.
208 KiB
1636x896px
208 KiB
1636x896px